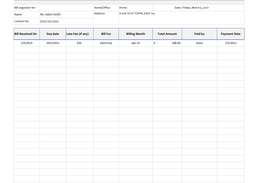
Create and update applications for payments.
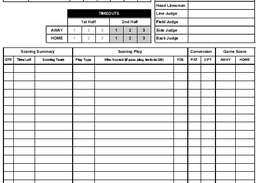
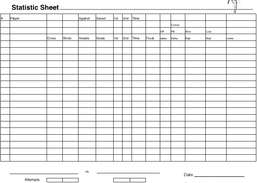
Record, track, and analyze the performance of your soccer team.
Add new powerful data access functions to Excel.
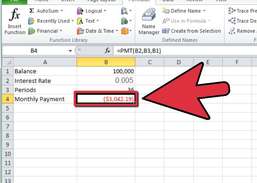
Add time savings analysis and worksheet management features to Microsoft Excel.
Add 40 generic functions to Microsoft Excel for SCADA users and tag/script editing.
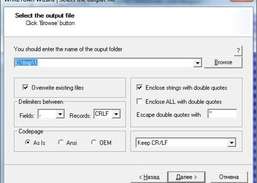
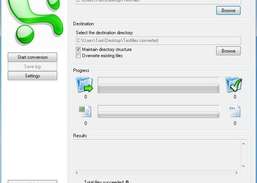
Convert Excel XLS files to CSV format.
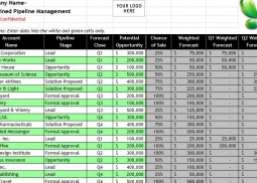
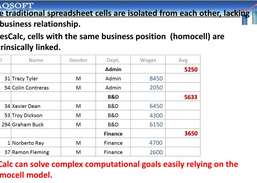
Manage and track your company sales in MS Excel.
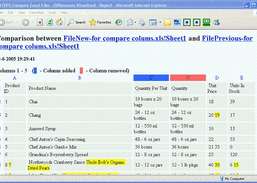
Find errors and compare large amount of numbers, text, and dates easily.
Analyze spreadsheets to determine differences.
Create XYZ graphs, charts and CAD objects, auto-fit surface equations to 3D data in Microsoft Excel.
Report the differences between two Microsoft Excel spreadsheets.